

If you’ve ever wondered what’s really happening on your network, which packets are flowing where, what protocols are in play, and why things sometimes slow to a crawl, then Wireshark is your friend. It’s the go-to tool for network analysis, trusted by sysadmins, security analysts, and engineers worldwide.
In this post, we’ll cover how to install Wireshark on different platforms and walk through the basics of using it to capture and analyze traffic.
Installing Wireshark
Wireshark is free, open source, and available for all major operating systems. The installation is pretty straightforward:
On Linux
Most distributions include Wireshark in their package repositories. For example:
# Debian-based
sudo apt update
sudo apt install wireshark

# RedHat-based
sudo dnf install wireshark-qt
During installation, you’ll often be asked if non-root users should be allowed to capture packets. It’s usually safer to say no, and later add specific users to the wireshark group if needed.
On macOS
If you use Homebrew, the installation is one line:
brew install --cask wiresharkBy default, Wireshark uses ChmodBPF to manage permissions so you can capture packets without root.
On Windows
Download the installer directly from wireshark.org.
The setup wizard includes Npcap, the packet capture library for Windows. Make sure it’s checked during installation because without it, Wireshark won’t be able to capture traffic.
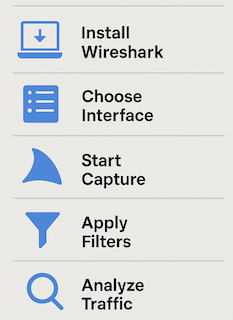
Capturing Traffic
Once Wireshark is installed, here’s how you start exploring your network:
- Open Wireshark: You’ll see a list of available interfaces (Ethernet, Wi-Fi, VPN, etc.).
- Choose an interface: Select the one that carries the traffic you want to monitor. For most, that’s your Wi-Fi or Ethernet card.
- Start capturing: Click the blue shark fin icon. Packets will begin scrolling in real time.
- Stop when ready: Use the red square button to end the capture.
Understanding the Interface
Wireshark’s main window is divided into three panes:
- Packet List (top): Each line is a captured packet with timestamp, source, destination, protocol, and info.
- Packet Details (middle): Click a packet to see its protocol layers broken down (Ethernet, IP, TCP/UDP, application).
- Packet Bytes (bottom): The raw data, shown in hex and ASCII.
Filters: The Real Power of Wireshark
Without filters, you’ll drown in packets. Wireshark lets you zero in on what matters with powerful display filters. Some common ones are:
- ip.addr == 192.168.1.10: Only packets to/from a given IP.
- tcp.port == 443: Show HTTPS traffic.
- http: Filter for HTTP packets.
- dns: View DNS queries and responses.
- tcp.analysis.flags: Find retransmissions and out-of-order packets.
You can also combine them, like:
ip.addr == 192.168.1.10 && tcp.port == 22This shows only SSH traffic for a specific host.
Practical Use Cases
- Troubleshooting connectivity: See if packets are dropped or delayed.
- Analyzing latency: Check TCP handshake times or DNS resolution delays.
- Security checks: Spot suspicious traffic, like unknown IPs or unexpected protocols.
- Protocol learning: Drill down into how protocols like TLS, DHCP, or SMTP really work.
Tips for Everyday Use
- Capture with care: Wireshark sees everything on your interface. Be mindful of privacy and legal constraints.
- Save captures: Use .pcapng files to share captures with colleagues or revisit them later.
- Colouring rules: Wireshark highlights different traffic types with colours. Use this to quickly spot anomalies.
- Limit captures: Apply capture filters (e.g. port 80) if you only want specific traffic from the start.
Final Thoughts
Wireshark is like an X-ray machine for your network. Installation is simple, but the real value comes from learning how to filter, interpret, and act on what you see. Start small by capturing some HTTP or DNS traffic, apply filters, and watch the protocols unfold. Over time, you’ll develop the intuition to spot issues before they escalate.
At the end of the day, Wireshark doesn’t just show you packets, it shows you the truth about what’s happening on your network.