
When something goes wrong in a system or database, the first instinct is often to open logs, tail them frantically, and hope the root cause jumps out. Sometimes you get lucky. Most of the time, you just end up with tired eyes and a stubborn problem.
That’s where the Golden Signals come in. They’re not magic, but they’re the simplest, most effective way to structure your troubleshooting. Instead of drowning in data, you focus on the four vital signs every system shows: latency, traffic, errors, and saturation.
Let’s break them down with a DBA/sysadmin hat on.
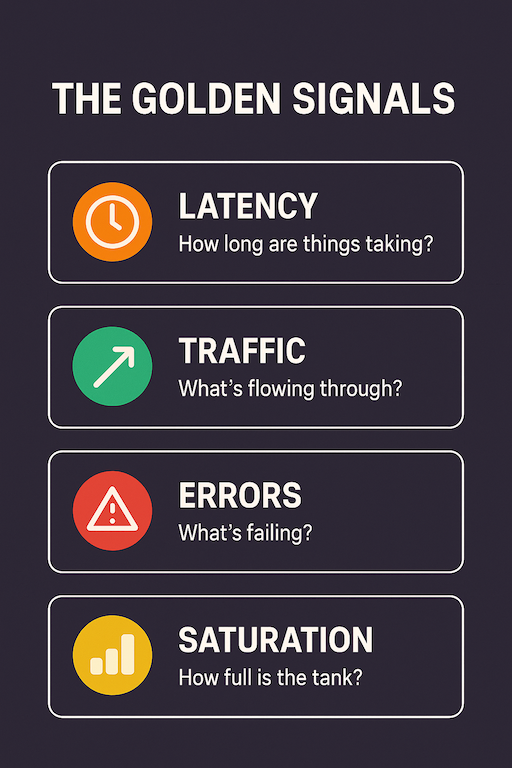
Latency: How long are things taking?
This is usually the first thing your users will notice:
- Queries feel slow
- App times out
- Reports that used to take seconds now run for minutes
In database terms, latency could be query execution time, replication lag, or the round-trip time for connections.
In infrastructure terms, it’s how long an API call or service request takes.
One good tip is to always ask: Is the latency caused by the system itself (CPU, locks, slow disk), or by something external (network, overloaded downstream service)?
Traffic: What’s flowing through?
Traffic is about how much work your system is being asked to do.
- Number of queries per second
- Transactions per minute
- Incoming connections to the database
If traffic suddenly spikes, that’s often a clue. Maybe a batch job started, or a misbehaving app is flooding the DB with queries. If traffic drops to zero, that’s a different type of alert. Users may have lost connectivity, or the app may be down entirely.
High traffic with high latency often means overload. Low traffic with high latency? That’s more likely a system problem.
Errors: What’s failing?
Every system lies eventually, and the truth comes out as errors. In databases:
- Failed queries
- Replication errors
- Constraint violations
On the infrastructure side, errors might show up as HTTP 500s, connection resets, or authentication failures.
It’s good to not just count errors but categorize them. A 2% error rate may not sound terrible, but if it’s in login transactions, your entire user base is locked out.
Saturation: How full is the tank?
Saturation tells you how close your system is to its limits:
- CPU pegged at 95%
- Disk I/O queue filling up
- Connection pool maxed out
This is the signal many people obsess over (because it’s measurable and obvious), but it’s just one piece of the puzzle. A server can be at 80% CPU and still healthy, as long as latency and errors are fine. But if saturation keeps climbing while traffic is stable, you’ve got a capacity issue in the making.
About saturation trends, bursts are normal. Slow, steady climbs are warnings.
Putting It All Together
When the pager goes off and you’re in firefighting mode, the Golden Signals give you a mental checklist:
- Latency: Are things slowing down?
- Traffic: Is load higher (or lower) than normal?
- Errors: What’s breaking?
- Saturation: Are we hitting a wall?
By walking through them in order, you avoid jumping blindly between random dashboards or logs. You start with the symptoms users feel (latency and errors), then check the underlying causes (traffic and saturation).
Final Thoughts
The Golden Signals aren’t a replacement for deep knowledge, but they’re the best way to triage quickly. They keep you from getting lost in the noise when production is burning.
As DBAs and sysadmins, our job isn’t just to fix issues, it’s to reduce mean time to understanding. If you can answer the Golden Signals in the first five minutes of an incident, you’ve already cut troubleshooting time in half.
What about you? Do you use the Golden Signals when debugging your systems, or do you have your own mental checklist?